Sigmoid#
Introduction#
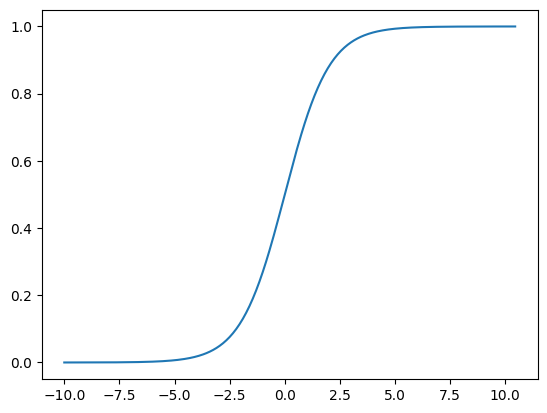
Sigmoid is often used to approximate probabilities, due to the fact that a sigmoid function’s maximum value will never exceed \( 1 \), and will never get below \( 0 \).
Definition#
sigmoid(\( x \)) = \( \frac{1}{1 + e^{-x}} \)
How does sigmoid look, and how it works in code?#
%matplotlib inline

import numpy as np
from matplotlib import pyplot as plt
def sigmoid(x):
    return 1 / (1 + np.exp(-x))
x = np.arange(-10, 11)
y = sigmoid(x)
print("x =", x)
print("y =", y)
x = [-10  -9  -8  -7  -6  -5  -4  -3  -2  -1   0   1   2   3   4   5   6   7
   8   9  10]
y = [4.53978687e-05 1.23394576e-04 3.35350130e-04 9.11051194e-04
 2.47262316e-03 6.69285092e-03 1.79862100e-02 4.74258732e-02
 1.19202922e-01 2.68941421e-01 5.00000000e-01 7.31058579e-01
 8.80797078e-01 9.52574127e-01 9.82013790e-01 9.93307149e-01
 9.97527377e-01 9.99088949e-01 9.99664650e-01 9.99876605e-01
 9.99954602e-01]
When the number gets big, the value of sigmoid gets very close to \( 1 \). When the number gets very negative, the value of sigmoid gets very close to \( 0 \).
x = np.arange(-200, 210) / 20
y = sigmoid(x)
plt.plot(x, y)
plt.show()